Background:
During the fifth week of school our class was tasked with the objective to both familiarize ourselves with the use of unmanned areal systems (UAV), and to get a general understanding for how the UAV operates in its collection. However, I was unfortunately gone to attended one of my roommates funerals so I was unable to join the class for both the field collection and the lab flight simulator. Instead Dr. Hupy decided that it would be in my best interest to still get acquainted with how UAV data is displayed through Pix4dMapper and understand the general processes of a UAV system without being able to run through the flight simulator or be out in the field during collections.The collection that was done by our class was on the north bank of the walking bridge shore line near the rivers edge. Dr. Hupy had taken the class out near the study area and flew their predetermined flight path. After the collection was completed all students including myself where asked to generate by a mosaic raster of the images and a DSM of the area.
Methods:
The collection of the data was completed using a multirotor UAV model DJI Phantom (figure 1). |
| Figure 1: DJI Phantom model used in UAV collection in tidal zone near University of Wisconsin Eau Claire |
 |
| Figure 2: generic model of a mission flight plan, generated in lab setting and would be used as flight for survey. Controlling speed, pictures, and path. |
Once all of the photos are collected we then needed to generate a orthomosaic. Which is a mosaic that utilizes geospatial references to directly lay the photos in the exact location spatially on the earth. It accomplishes this by using the internal GPS unit within the UAV. In the lab we used Pix4dMapper to upload and process our photos collected. The task of generating the orthomosaic is a simple task and can be done in three steps, 1) open Pix4dMapper 2) open new project and upload all photos for your survey 3) a lot of patients. The program itself has to process a plethora of text files and coded inscription along with running countless amounts of mathematical equations in order to not only produce a raster mosaic of your survey but to also have the mosaic spatially implanted into any area. Since this is the case you should expect any project including more than 30 photos to take a minimum of hour to two hours to run.
Results:
Although the program may take a long time to produce an image the reward is definitely worth the wait. After the program generated the mosaic you now have both clear and accurate maps of any survey area you flew. The only variance you will have in quality is based on the number of photos and angles at which the photos where taken. The more photos and angles the more accurate and clear your mosaic will turn out, but will require more time to process.The first collection the study area were everyone was watching the flight of the Phantom shows a variety of possible aspects the UAV's can capture. It displays not only the ability to display separation between structures like the people standing on the ground. It can also capture elevation within the picture allowing you to display true heights of features. and through rendering in Arc Scene you can display shading bring more contrast to the picture showing even more detail in all the features all of which can be seen in figure 3.
 |
| Figure 3: Mosaic generated from Pix4Dmapper |
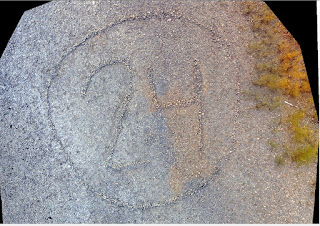
The second collection and output is my personal favorite for although there was not much contour to the area I could not believe the quality of the mosaic. It not only depicted the 24 within the rocks but it also had detail to the extent where you could see all the individual rocks within the tidal zone. After altering the shading and light contrast I was able to generate a amazing oblique image that shows the slight elevation changes in the feature but also the clarity within the photo itself. (figure 4).
No comments:
Post a Comment