Thursday, December 17, 2015

UAS

Background:

During the fifth week of school our class was tasked with the objective to both familiarize ourselves with the use of unmanned areal systems (UAV), and to get a general understanding for how the UAV operates in its collection. However, I was unfortunately gone to attended one of my roommates funerals so I was unable to join the class for both the field collection and the lab flight simulator. Instead Dr. Hupy decided that it would be in my best interest to still get acquainted with how UAV data is displayed through Pix4dMapper and understand the general processes of a UAV system without being able to run through the flight simulator or be out in the field during collections.
The collection that was done by our class was on the north bank of the walking bridge shore line near the rivers edge. Dr. Hupy had taken the class out near the study area and flew their predetermined flight path. After the collection was completed all students including myself where asked to generate by a mosaic raster of the images and a DSM of the area.

Methods:

The collection of the data was completed using a multirotor UAV model DJI Phantom (figure 1).
Figure 1: DJI Phantom model used in UAV collection in tidal zone near University of Wisconsin Eau Claire
In order for the UAV to work and capture images you have two options. The first is a manual flight where you control where and when each data point with picture is taken. The Second is by utilizing a program called mission planner which is a program that is utilized in the lab before one enters the field where you can predetermine both the flight the UAV will take and how many photos will be captures within the flight. (figure 2).
Figure 2: generic model of a mission flight plan, generated in lab setting and would be used as flight for survey. Controlling speed, pictures, and path.
Since our project did not require a lot of photos nor did it need a specific path to travel we decided to run the Phantom manually. The area that where photographed where to zones one was a circle with the number 24 in the middle located near the tidal zone of the river. Both the circle and the numbers where created using various rocks. The second area surveyed was the intertidal zone where the class was spectating the UAV being flown. Both surveys offered very different aspects to show the general abilities the UAV collection can offer. For example the first survey of the class and the surrounding terrain offered a glimpse of the clarity the UAV can provided. The second gave a slight glimpse into the capabilities for the UAV to generate superb elevation models of any mission it is flown on.

Once all of the photos are collected we then needed to generate a orthomosaic. Which is a mosaic that utilizes geospatial references to directly lay the photos in the exact location spatially on the earth. It accomplishes this by using the internal GPS unit within the UAV. In the lab we used Pix4dMapper to upload and process our photos collected. The task of generating the orthomosaic is a simple task and can be done in three steps, 1) open Pix4dMapper 2) open new project and upload all photos for your survey 3) a lot of patients. The program itself has to process a plethora of text files and coded inscription along with running countless amounts of mathematical equations in order to not only produce a raster mosaic of your survey but to also have the mosaic spatially implanted into any area. Since this is the case you should expect any project including more than 30 photos to take a minimum of hour to two hours to run.


Results:

Although the program may take a long time to produce an image the reward is definitely worth the wait. After the program generated the mosaic you now have both clear and accurate maps of any survey area you flew. The only variance you will have in quality is based on the number of photos and angles at which the photos where taken. The more photos and angles the more accurate and clear your mosaic will turn out, but will require more time to process.

The first collection the study area were everyone was watching the flight of the Phantom shows a variety of possible aspects the UAV's can capture. It displays not only the ability to display separation between structures like the people standing on the ground. It can also capture elevation within the picture allowing you to display true heights of features. and through rendering in Arc Scene you can display shading bring more contrast to the picture showing even more detail in all the features all of which can be seen in figure 3.
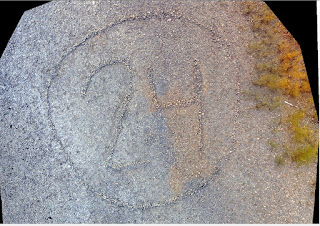
Figure 3: Mosaic generated from Pix4Dmapper 


The second collection and output is my personal favorite for although there was not much contour to the area I could not believe the quality of the mosaic. It not only depicted the 24 within the rocks but it also had detail to the extent where you could see all the individual rocks within the tidal zone. After altering the shading and light contrast I was able to generate a amazing oblique image that shows the slight elevation changes in the feature but also the clarity within the photo itself. (figure 4).


Discussion:

Although I am very disappointed I was unable to see the UAV in action and experience the ability it has. I am very glad I was able to witness the final product that one can create. Even from a simplistic survey such as the two our class took that only had at most 100 photos the clarity and accuracy was superb. I can full comprehend why so many people have started to become open minded and eager about utilizing UAV more into surveys and scientific studies for there ability to capture unimaginable imagery. However, I also would aid on the side of caution that although this new technology is cutting edge and out produces most of the products available to us we all need to remember to follow all flight guidelines and also to not survey unethically. Just because we now have the ability to fly farther and survey more does not mean we have the right to do so.

Tuesday, December 15, 2015

Navigation of Priory with Compass

Introduction:

Map and compass have been a suitable method of navigation for many years until the development of Geographic Positioning Systems. However, even when GPS are present they can malfunction or break and leave the user to use traditional methods of navigation. 

In this exercise we where tasked to use our maps made in the previous week of the Priory to navigate to five points located throughout different location within the priory land area. The priory was chosen as a site to conduct the test for it is an area of land owned by the campus but over the few years of owning it the priory has not found much practical use for our student population. because of this we decided that with the multiple terrain types we would be exposed to many challenges with our traditional land navigation. Throughout the priory we had sever elevation changes, multiple vegetation changes, and even small portions of water (pond and a creek). 

Methods:

To conduct the land navigation we needed to make sure we had the proper equipment
  • Two maps printed on paper ( 1 UTM, 1 WGS)
  • Compass
  • Ruler
  • Marker
After we had all of the tools we first where given a crash course on how to use the compass to determine our direction in which we wanted to walk. As we where standing in the parking lot Dr. Hupy showed us that to use the standard compass we first needed to find north. this is accomplished by  putting the red arrow inside of the red outline, also known as putting the red in the shed. This shows you where true north is. Once you have found this it is wise to orient your map with the north in the same direction.(Figure 1.1) By setting the anchor point of the compass on the bottom at your starting point you then will aim the directional arrow to the destination point. After your start point and directional arrow are in a straight line to your target you need to put the red arrow back into the red outline. A full tutorial can be found on the USGS website (http://education.usgs.gov/lessons/compass.html).  Once completed the degree marked by your directional arrow is the degree in which you need to walk. Follow getting the directional degree you then need to measure the distance to find how far you need to walk. By using the scale you will know your total distance needed to reach the point. Knowing this distance and the amount of steps it took to walk a hundred meters determined in the previous class as 60 paces equals a hundred meters you can do a simple cross multiplication to know how many paces it will take to walk the distance. 
Once the distance and direction are determined we then needed to take action and pace off our path. We accomplished this in a team effort by having the first person determine a land marker in the direction we needed to keep and the second person would pace off how many steps counting every right foot placement as one to the landmark. The note taker would follow the first person and record how many paces it was. Once the first person would reach the landmark the original compass holder would then pace to the same landmark to reassure the pace count. The process would then be repeated until you reached the theoretical pace count.

Figure 1.1 showing compass similar to the ones used in our activity and orienting the compass north with the map in same direction.
Once in the woods we needed to use our knowledge and best estimate as to how far our actual pace count would be. For example we paced off the direction until we reached our theoretical pace count but if we did not see the destination we then continued to count until we reached the marker. In our test they where trees with pink ribbon around then. For some of the points if we where walking up steep inclines or through thick brush our steps where not as long as the original paces taken on the flat sidewalk and in some cases our pace count almost doubled in length. Since this is the case you need to use best judgment to know if your are stepping the same distance as on the sidewalk. Lastly the only other technique that we needed to use was a mathimatical equation to get around hazardous areas. In one of our paths we would have needed to walk down a steep decline with garbage ( iron tubs at the bottom, however, we avoided the area by walking in a safer direction and then turning 90 degrees to our original land mark noting how far each pace was on the two lines and used a simple equation of a 90 degree triangle a^2+b^2=c^2 figure 1.2. This equation allowed us to get the hypotinus or straight line step without having to put our selves in danger of harm.
Figure 1.2: side a and b are the two sides that allowed us to avoid the hazard, side c was our true path we needed to take to our landmark. This process allowed us to be safe in our task but to obtain the same pace count and direction

Discussion:

Once a the priory we where given our five points in decimal degrees and needed to transfer the points manually onto our map so we could follow the previous procedure of obtaining our azimuth and pace count. We decided to use the back of the priory right where the concrete meet the door so it was a distinctive spot on the map to measure off of. We then calculated all of our points and started our journey. We had a rough start in our process for although theoretical we where walking in the right direction at one point we began to veer north this caused us to end at our final pace count on the bottom of the first elevation drop and about 50 meters west and down hill of our destination point. As you can see in our track log for most of our points we never walked directly to them. (Figure 1.3). We would get into the general vicinity but then need to walk in both directions visually looking for our target.


Figure 1.3: track log of journey including our five waypoints we needed to locate


Conclusion:

In the end the course was very helpful it allowed us to see the difficulties that can arise if your electronics would fail or I you did not have access to any modern techniques. It also enlightened us on useful techniques of mapping with a compass. Although our group was not very efficient at finding the waypoints and did not do our best at making sure we where on a straight path each time we where walking as one can see from our track log. The activity opened my eyes to how challenging and impressive surveying was before the implication of GPS. The difficulty level for us to find the brightly marked trees was superbly difficult now try and find a small point unmarked. This task would be almost impossible without years of practice and patients.

I am  very pleased I was able to participate in this activity for now I can say I have a greater understanding for what I need to improve on in order to better navigate through the woods using a paper map and compass.

Wednesday, December 9, 2015

Arc Collector

Background: 

Week eleven and twelve of the fall semester we where tasked with the objective to use a new and most likely the next big trend in geospatial technologies Arc Collector. Which is a self generated online collecting applications that can be used through any smart phone or tablet. The technology is very similar to Arc Map but instead of having to collect you points and then import them into ArcMap you now can collect and generate your attribute table directly into the application. This new unique technology is making it easier for an organization or lone person to create feature classes and by overlaying a base map can use his own GPS on his or her smart phone or tablet and collect not only the spatial point or line or polygon, but can immediately enter all of the predetermined attributes including any determined domains or sub types. The cutting edge technology will pave the way to the future and because of this training in these weeks I can say I will be one laying down some tar for the road.

Methods:

Before we could go into the field and collect our points we first needed to become familiar with two things. First how to create our own feature class and attribute domains and sub types. Next we then needed to be shown how to upload our maps and how to use Arc Collector. 

First when generating our feature class we all needed to decided what kind of collection we wanted to do. I decided to collect point data looking into the types of trees related to the number of squirrel nest in them and if there was a squirrel present in the tree at the time. Now that the topic was determined we had to generate specific attributes I wanted to be included. I decided to included the type of tree in its basic form of (pine, oak, maple, birch, ash, and other), I also wanted to know the size of the tree ( less than 5 feet, 5<x<10 feet,10<x<15 feet, 15> feet), I also wanted to record how many nest where in the tree, if a squirrel was present, what kind of squirrel was in the tree (red, grey, black, chip, other) and how many squirrels where in the nest. Finally for each point I collected the date and time.
The collection was completed on November, 23 and I had successfully collected 15 points. 
This first collection was put in place as a practice collection and was to show us any kinks that we may need to work out in our design and utilization of Arc collector program.  

The second map I had decided to design would identify any concrete sidewalk pad within all of the streets between first and second ave in the student housing area near water street Eau Claire Wisconsin. For this collection I decided to over pay a street basemap with the attribute fields including one for dimensions of the pad, type of damage, if the damage needed immediate repair, and if the pad was level concave or convex. I was hoping to generate a hazardous map that could potentially be turned into a web app and allow public access for entire helping the town identify hazardous sidewalks that should be repaired to avoid lawsuit.  

Proper upload of either map was done in similar fashions. Once the feature class was created you then could upload your feature class to arc map online. This would allow you to create your arc collector app. First you needed to log into arc online. Once there you could share services and follow the wizard through the process two key points are however, that you need to change the features to feature access  in order to be allowed full access when entering data. Last when it asks where to upload the feature class to we where to select UW geography folder so we could locate the feature class online. Once the feature class is published if you make any changes to the field domains or sub-types you will have to re upload the new version of your feature class before it will be changed in arc collector. 

Last you then can add you feature class to arc collector by searching the UW geography folder for the name of your feature class. Add the feature class to the base map of your choice and share your map to the UW geography department where you will be able to access it from the Arc Collector app on your smart phone or tablet. 

Results: 

After the first arc collector I was unsuccessful to draw an conclusions as to what types of trees squirrels prefer for nesting. I was unsuccessful in finding significant data for a couple of reasons. One being my lack to accurately identify each tree species precisely. I was using a key given to through the biology department however, it was mainly used during spring using leaf identification but since all of the leaves where gone I was unable to identify for certain the tree species. Second I had numerous issues with my feature class attribute input. For example I did not successfully set up the domains for two of my fields and could not collect tree size or time. Both fields where altered and there for could not be used in the analysis. However, I was able to generate a preliminary map giving a general idea to the potential of this application if working at its optimal ability (Figure 1).
Figure 1: preliminary collection of tree type and both number of squirrel nest and squirrels present in each tree collected. The data used was to highlight any flaws made in the feature class and prepare to make final collector map for practical use in the field
 

Figure 2: collection of damaged cement pads through all streets
between first and second avenue within the water street district
of Eau Claire Wisconsin
The second collection was much more successful since I was able to correct some of my mistakes in our practice collection. However, I still could not fix the time field and after communicating with other peers I found this to be similar case with all students. 
Although the rest of the collection was very smooth and allowed me to identify potential hazardous areas where the sidewalks should be fixed. As one can see in figure 2
the two main areas that need immediate attention are on second avenue located on either side of Niagara street. The second location was most of Broadway street where a lot of the pads had sever cracks. 


Conclusion:

In the end I was able to obtain a better understanding for the implications Arc Collector could have on our future. It was very interesting to see technology becoming so advanced that we can now have very detailed spatially accurate collection from the one device that so many Americans already use everyday. I was a little disappointed in the fact that the application needed data at all times and would not be useful in situations where service was unavailable or slow service would make for inaccurate and slow collections. All together I can say I learned a lot about Arc collector and now know a little more about designing my own feature class and generating domains and sub types along with more knowledge on when is an appropriate time to create a sub type or make a new field. 
I am very glad I was introduced to Arc collector and can even say that I have been using it in my personal life as well by creating a fishing application that will help me to analyze the behavior of fish throughout my trips narrowing down on patterns and hopefully produce more fish fry for myself. 
Although this was just a scratch at the surface of what Arc Collector can do I hope this will not be the last time I have to use this application for a company project. 

Sunday, December 6, 2015

GPS and Total Station

Background: 

Figure 1: Topcon Tesla Unit for GPS point collection of mall at
University of Wisconsin Eau Claire
for weeks 9 and 10 our class was tasked with the objective to utilize two different methods of collecting survey grade point collection of the campus mall area. Our first collection utilized the Topcon Tesla (survey grade GPS unit figure 1) and also the Topcon Hiper SR (survey grade elevation calibrator figure 2). The week that followed our collection with the Tesla we where then to survey the mall area with the Topcon GPT-3100W total station. The total station is a stationary survey grade unit that shoots a laser to a 2 meter high reflector that allows you to collect multiple points from without having to move you collection station. After the two collections where finished we where to generate two separate continuous surface models and determine the pros and cons of each collection method to determine the best fit for each collection. 
Figure 2: Topcon Total station used in our second collection of
the mall of the University of Wisconsin Eau Claire


Methods: 

In week nine we where set out with the Tesla to collect a total of a hundred points within a 25 x 25 foot plot. Although our collection was easy there was a few stepping stones we needed to overcome before we started the collection. First was that we needed to connect to both the WiFi and the hyper unit in order to be able to collect elevation. We had a lot of complications with the connection and found that you first needed to turn on the Tesla unit before connecting to either of the other two units. Once connected we then needed to create a job to store our collection points. This was also an issue for the licensing for the Tesla had recently been canceled and we where only able to collect a total of 25 points per job. Because of this we needed to make for different jobs to collect a total of 100 points. Once the set up was complete we where able to start collecting our points. To accomplish this we needed to make sure a couple of preliminary objectives where completed. First we needed to make sure the hyper was level by shortening or extending the legs of the Hiper unit. Once level you are able to see the leveling bubble inside of the black circle meaning you are now ready to collect the point (figure 3).
Figure 3: once the Hiper is level the bubble will be centered in the black ring. 
Once the Hiper is level and set you then can run the collection. There are two options available to you when collecting one is a quick collect that will take less time but is not as accurate for it will take less points and does not run as much for mathematical algorithms in the programming. The second is a complete collection which takes more points and will average out the points to generate a more accurate and precise point collection. For this survey we mainly collected using quick points to save time and also because of the situation we did not need extremely accurate points for this collection. Once all hundred points where collected we had completed the first task and the following week we then collected the other points with the total station.
The second collection with the total station was done the week of thanksgiving on November 23. This collection would only be a total of 25 points for we still did not have full access to the licensing and Dr. Hupy decided that we would understand the process enough after 25 collection points. To collect points using the total station the equipment you needed are the same as the GPS collection including the Tesla, Hyper and WiFi, and also needed the Topcon Total station. For collection you first need to use the Tesla and locate three points. The first is the occupation site. or where the total station will be set up. The other two are back site points for the total station to use as azimuth lines and can then figure out what the coordinates of your points are. Once these three site where located using similar methods as the GPS collection we then could obtain our remaining 22 points. when using the Total station you first needed to level the station over the station over your acquired occupational site. To level the station you need to adjust all three legs to get it rough leveled then by using the three nobs located at the base of the station head unit you will adjust two at a time rotating around in a clock wise circle only adjusting one nob at a time to level the unit. A word of caution would be to try and not move the knobs that you have already adjusted so you do not continue to level the unit. Once leveled you then can obtain your points this will be completed by one team member who will carry the reflector unit out to the point that you want to connect. That person will then hold the two meter high adjustable pole with the reflector unit level so the team member can focus the stations lazer into the reflector head. Once the station has been tartgeted to shot the laser at the reflector unit the point can be collected with the same options of either the quick or standard collection. The process will be repeated until all points are collected.

Results: 

Figure 4: spline continuous raster generated from the GPS collection
The results where very interesting for I could easily see how each method would be useful depending on specific situations. For example when using the Tesla for collection it was a simple process to travel to multiple points and simple move two legs to level the unit. Where with the total station  you needed to  refocus scope and initially set up a very cumbersome unit. Some other advantages the Tesla had over the total station was that the preliminary set up was quicker and easier to set up. However, the downsides of the Tesla unit was that it needed to have access to WiFi in order for the Hiper to operate, and the unit itself was very finicky when running. On the other hand the Total station did have its advantages over the Tesla and they where that collection was very fast once all of the initial set up was completed. 

Although our original task was to compare the generated continuous surface raster with each other it was very difficult to have a true comparison, for we collected four times as many points with the Tesla than the total station making it by far more detailed and accurate. The results are as followed with figure 4 showing the map generated by the Tesla and figure 5 being the map generated from the total station.. As one can see although we only collected 25 points with the total station the results are very similar other than varying in break lines. The general trend of where the slope begins and the low areas the total station generated impressive results with such a low sample size. 

Figure 5: Spline model generated from the 25 points collected by total station


Discussion/Conclusion: 

Both of the collections where very unique to themselves for each one produced different complications. From not being able to connect with servers, to not being able to focus the laser. Both units produced many challenges that needed to be overcome. With each unit being unique each one offered different options to collecting, although the Tesla was easier to set up I could see how over a longer time frame or if more than a hundred points needed to be collected the process would take a lot longer than the total station. If I had to pick one unit over the other I could want to use the Tesla fr you did not need as much equipment, the set up was easier and the collection could potentially be done with one person. It is because of the idea that similar grade surveying could be done with less people and less room for error I Personally think this is why that method is better overall. 


Equipment: 

Topcon Tesla GPS survey grade
Topcon GPT-3100W survey grade
Topcon Hiper
MyFi unit used for wireless connection
Reflector rod for total station